
Sometimes, a negligent error goes unnoticed under the radar, and it remains as an Achilles' heel unless it is understood and addressed properly to rectify it. One such massive error in medicine is 'the Use of “reference range” for comparing the patient's lab reports to be normal or abnormal'. Just look at the consequences, if there is an unnoticed deviation at the initial point of diagnosis. The interpretation of any clinical laboratory test involves comparing the patient's results with the test's "reference range".
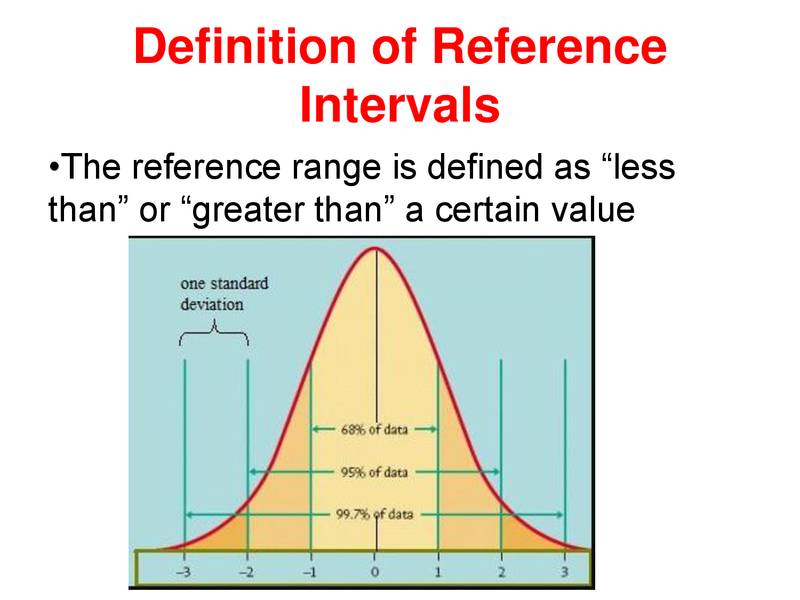
The first step in determining a reference range is to define the population to which the range will apply. A large number of individuals from a group who are thought to represent a "normal" population, will be tested for a particular laboratory test. The reference range is then derived mathematically by taking the average value for the group and allowing for natural variation around that value (plus or minus 2 standard deviations from the average). In this way, ranges quoted by labs will represent the values found in 95% of individuals in the chosen ‘reference’ group. In other words, even in a "normal" population, a test result will lie outside the reference range in 5% of cases (1 in 20). This is why the term "reference range" is preferred over "normal range".
When you examine test results from different populations, you quickly discover that what is "normal" for one group is not necessarily normal for another group. Indeed, in tests such as cholesterol profile, the idea of a normal range has been replaced to a large extent by use of target values, achieved either by lifestyle changes or active treatment.
Whether or not your test result is within the laboratory reference range, the result must be considered within the context of your personal circumstances, and with the benefit of your doctor's knowledge of your past medical history, current medication and the results of any other investigations.
Functional medicine addresses the underlying causes of symptoms instead of overriding them with drugs or surgery. One tool we use to accomplish this is to interpret blood tests using functional ranges, which outline the parameters of good health.
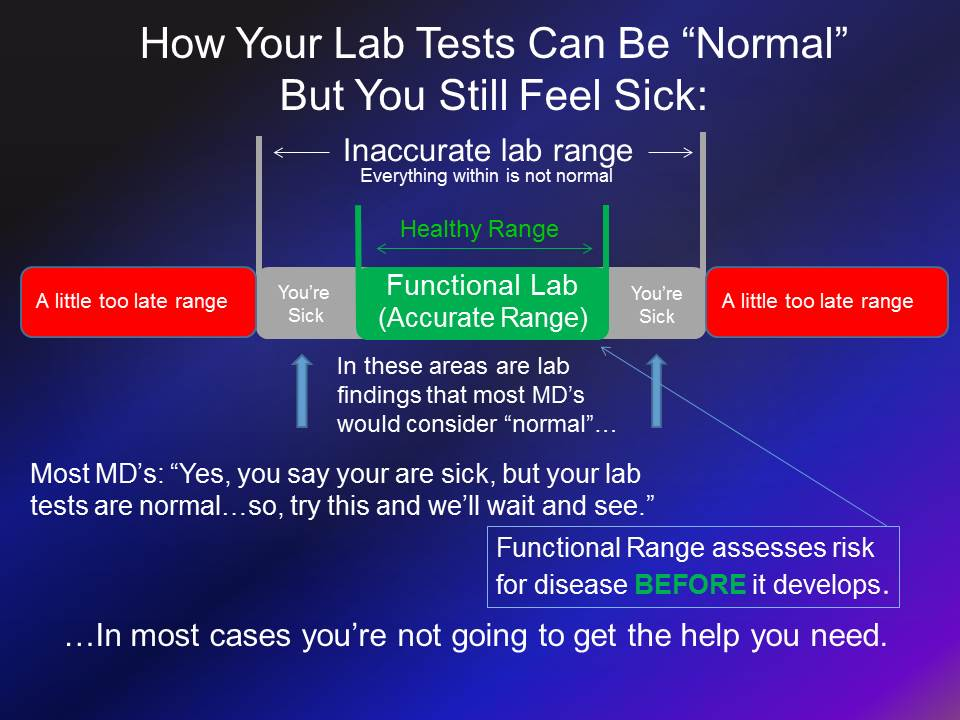
In contrast, the ranges most doctors use are based on a bell-curve analysis of all the people who visited that lab over a certain period of time, many of whom are very sick. These lab ranges have broadened over the last few decades as health of the reference population has declined. As a result, more and more people with real health problems are told they’re fine because their lab results fall within these wide ranges.
Do you really want to evaluate your health in comparison to all the sick people who visited your lab, or do you want to look at a blood test for what constitutes good health?
A blood test for functional medicine also includes more markers that standard blood tests. For instance, many doctors only look at thyroid profile, a basic thyroid marker, when running a blood test for hypothyroidism. Hashimoto’s thyroiditis is an autoimmune disease that attacks and destroys the thyroid gland, which is responsible for 90 percent of hypothyroid cases. Therefore, we also test thyroid antibodies to screen for autoimmunity along with other thyroid markers for more information. Auto-thyroid antibodies should be ruled out if diagnosis of functional hypothyroidism is to be made (e.g Insulin resistance & stress). Since we always work towards reversal of such conditions, follow-up auto-antibody is taken for confirming remission of Hashimoto's, whereas in conventional medicine, only TSH is taken as a parameter for follow-ups modulating the dose of thyroid medications lifelong.
Reference intervals are most commonly defined as the range of values into which 95% of non-diseased individuals will fall. Around 5% of non-diseased individuals can have laboratory results outside the reference range. Reference range can be used to separate normal from abnormal values. A patient's result can be outside the reference range without meeting the threshold.
| Conventional lab ranges | Functional lab ranges |
| Based on bell curve representing 95% of the normal population | Narrowed to show more appropriate range of the healthier population. |
| Test can be normal, but the patient is symptomatic | Can reveal the underlying cause of symptom. |
| Less sensitivity | Greater sensitivity |
| Either disease or health, no cautionary measures | Able to imbalances in chemistry before pathology |
| Varies from lab to lab; region to region | Not dependent on the population sampled or the geographical area. |
Functional | Pathological |
| Body as a dynamic complex interconnected system of mind, body and emotions. | Machine composed of separate systems reduced into its constituent parts |
| Emphasis: Identification of areas of imbalance or dysfunction in normal physiology | Identification of disease or pathological tissue change. |
| Diagnosis integrates data from many different systems and methods. | Extremely specialized |
| Treatment: Underlying cause of dysfunction | Symptomatic reductionism |
| Major focus: Objective and subjective information gathered on the basis of optimal physiological function | How the patient is doing on charts, statistics and test results that are measured against a statistical normal population. |
| Allows for an early prediction of dysfunction | Relies on late-stage development of disease as a marker. |
| Health is measured along a wellness continuum which is a spectrum moving from health to disease. Intervention can be made at every stage of the spectrum to restore health and wellness. | Health is measured as an absence of disease. So as long as you don’t have a disease, you are considered healthy. |
When analyzing blood issues, there are two main types of ranges in the field of blood chemistry analysis: a “functional” and “pathological range.” The “pathological range” used by all laboratories that perform blood chemistry analysis use these ranges. These lab reference ranges are formulated from testing sick people, not healthy people. Therefore, if you fall in this range, you may be told that everything is normal yet continue to have the same problems. A narrower lab range, which we use, is the “functional range.” Blood tests that focus on the “functional range” are taken from healthier people, and these tests are used to assess risk for health problems and to detect health challenges before they develop.
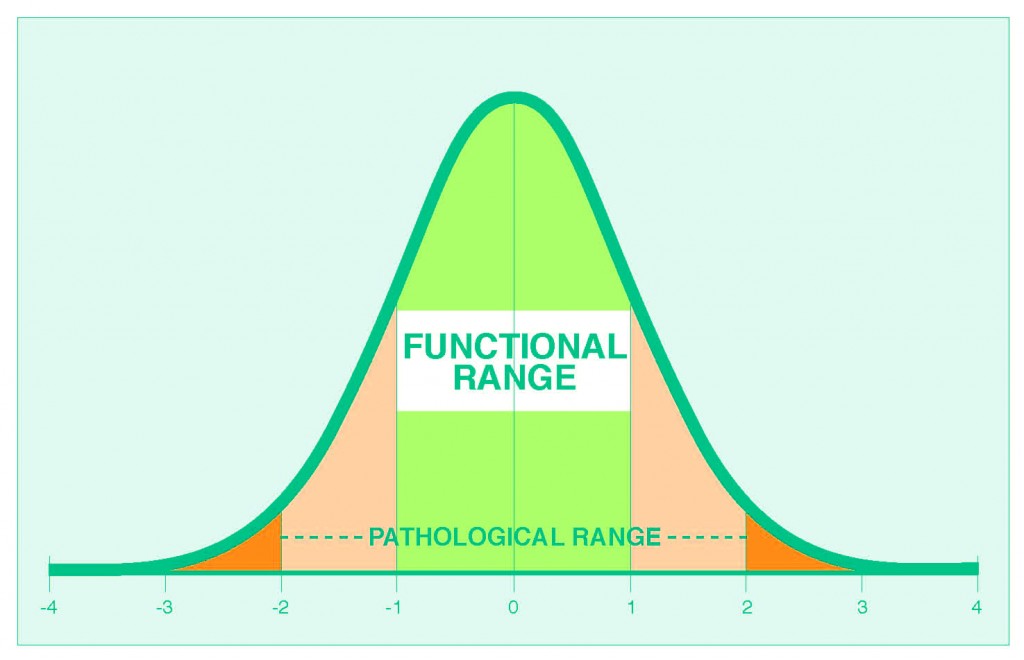
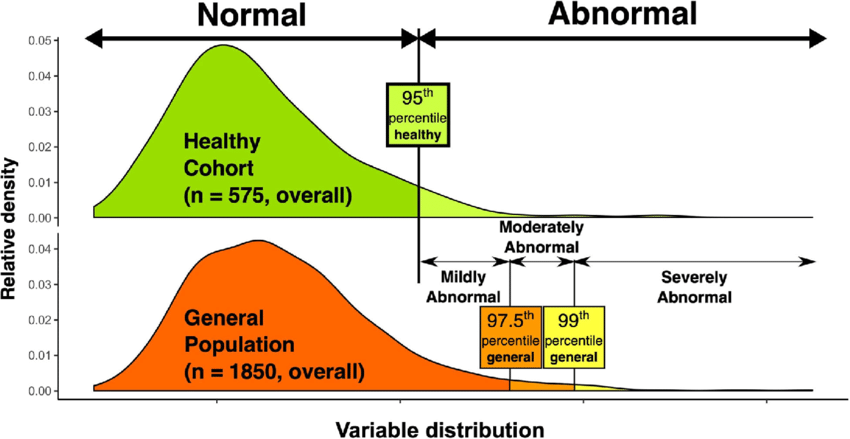
Illustration showing definition of reference ranges. Upper part of the figure shows distribution in healthy individuals, with the 95th quantile used to define abnormal value. Lower part of the figure shows the ways for defining different degrees of abnormality. Patients falling above the 95th percentile of the healthy population but under the 97.5th percentile of the general population were classified as mildly abnormal; those between the 97.5th and 99th percentiles of the general population as moderately abnormal and patients over the 99th percentile of the general population as severely abnormal.
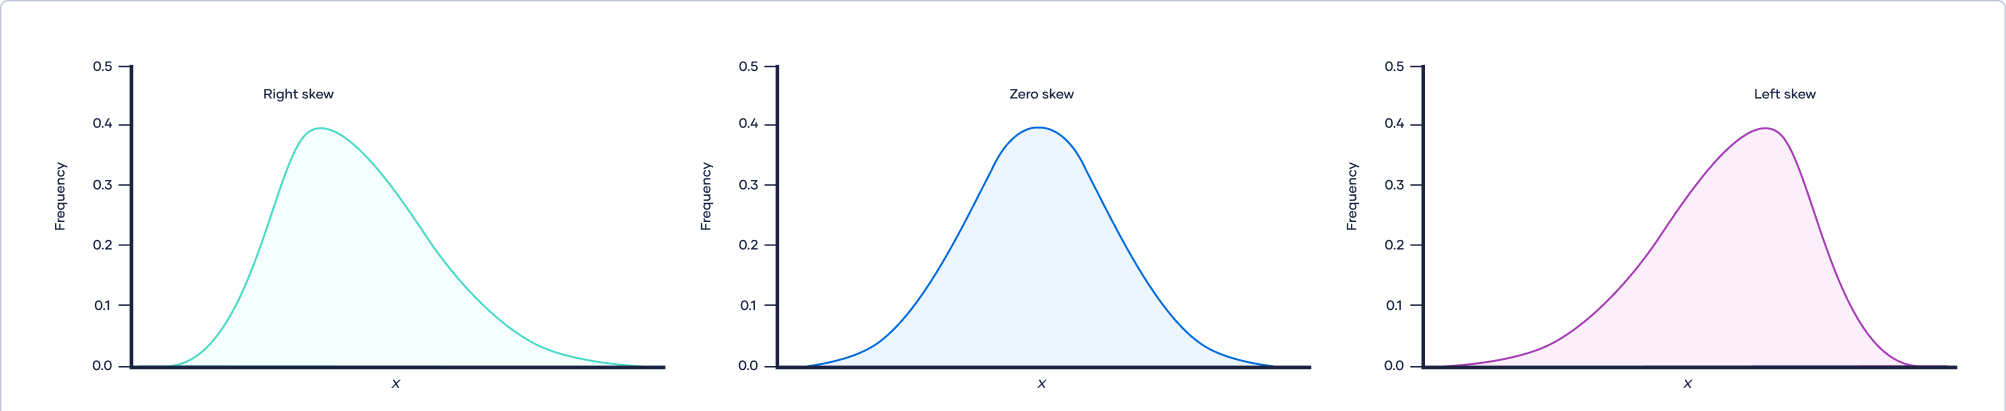
In the last 40-50 years, there is a rampant increase in NCDs primarily due to the change in the food system particularly ultra-processing of food and chemical farming. The whole population is shifting towards metabolic illness with only 10% of the adult's population is actually metabolically healthy, free of all the components of metabolic syndrome. The rest 90% is suffering from at least one or two components of insulin resistance. The reference range calculated nowadays is significantly different from the past, say for example in the 1980s, why? What if I say, the majority of the population itself is suffering from these conditions yet undiagnosed because of the massive shift in the distribution i.e.., skewed towards the right !!!
| Upper limit in Reference range | Upper limit in Functional range | |
| ALT | <40 IU/L | <25 |
| Uric acid | <7 mg% | <5.5 |
| Fasting Insulin | < 25 m IU/ L | <6 |
The functional range is nothing, but the reference range used before the major proportion of the population deviated from wellness. For instance, the reference range used for ALT in the 1980’s was 25 IU/L whereas now it is 40 IU/L. This is a negligence, a massive error in medical statistics!!! Similarly, the normal upper limit of uric acid has been raised to 7 mg% instead of the previously used 5.5 mg %; fasting insulin with wide range with an upper limit of 25 mIU/L is considered normal whereas the functional range is only up to 6 mIU/L. Since the so-called healthy reference population is affected sub-clinically, by the epidemics of NCDs (Non-Communicable Diseases), the reference range includes the high abnormal values as if it is normal. By doing so, the very basis of taking blood tests for screening & early diagnosis is severely hampered.
In this context of considering the upper limit of the above three parameters, if a person with blood test reports visits a physician, he will look up into the current reference ranges and give assurance to the patients that everything is normal (if ALT is between 26-40 IU/L; Uric acid 5.6-7 mg% & Fasting Insulin 7-25 m IU/L). Aren't we really missing a diagnosis? The patient continues to suffer from the disease, yet both the doctor and patient are completely unaware of this complexity in the lab reports!!! The patients in these abnormal ranges will continue to suffer from Steatohepatitis/ Hyperuricemia and Insulin Resistance respectively!!
Functional range should be taken as ideal in comparing the values to be normal or abnormal and not simply the reference range which highly misleads the whole scenario falling to diagnose the disorders at the earliest.
It is so crucial that we have to realize this blunder, initiate to standardize the functional range to every lab instead of using the current reference range.
Dr.R.R.Thangadurai M.S,


